Classes
Raster Maps
Raster
-
class
hubflow.core.Raster(filename, eAccess=<sphinx.ext.autodoc.importer._MockObject object>)[source]¶ Bases:
hubflow.core.MapClass for managing raster maps like
Mask,Classification,RegressionandFraction.-
applyMask(filename, mask, noDataValue=None, **kwargs)[source]¶ Applies a
maskto itself and returns the result. All pixels where the mask evaluates to False, are set to the no data value. If the no data value is nut defined, 0 is used.Parameters: - filename (str) – output path
- mask (Map) – a map that is evaluated as a mask
- noDataValue (float) – set no data value if undefined (default is to use 0)
- kwargs – passed to
hubflow.core.Applier
Return type: Example: >>> raster = Raster.fromArray(array=[[[1, 2, 3]]], filename='/vsimem/raster.bsq', noDataValues=[-1]) >>> mask = Mask.fromArray(array=[[[0, 0, 1]]], filename='/vsimem/mask.bsq') >>> result = raster.applyMask(filename='/vsimem/result.bsq', mask=mask) >>> result.array() array([[[-1, -1, 3]]])
-
applySpatial(filename, function, **kwargs)[source]¶ Apply given
functionto each band of itself and return the result raster.Parameters: - filename (str) –
- function (function) – user defined function that takes one argument
array - kwargs – passed to
hubflow.core.Applier
Return type: Example: >>> raster = Raster.fromArray(array=[[[1, 2, 3]]], filename='/vsimem/raster.bsq') >>> raster.array() array([[[1, 2, 3]]]) >>> def square(array): return array**2 >>> result = raster.applySpatial(filename='/vsimem/result.bsq', function=square) >>> result.array() array([[[1, 4, 9]]])
-
array(**kwargs)[source]¶ Return raster data as 3d array of shape = (zsize, ysize, xsize). Additional
kwargsare passed to Raster.dataset().array.
-
asMask(noDataValues=None, minOverallCoverage=0.5, indices=None, invert=False)[source]¶ Return itself as a
Mask.Parameters: - noDataValues (List[Union[None, float]]) – list of band-wise no data values
- minOverallCoverage (float) – threshold that defines, in case of on-the-fly average-resampling, which pixel will be evaluated as True
- indices (int) – if set, a band subset mask for the given
indicesis created - invert (int) – whether to invert the mask
Return type: Example: >>> raster = Raster.fromArray(array=[[[-1, 0, 5, 3, 0]]], filename='/vsimem/raster.bsq', ... noDataValues=[-1]) >>> raster.array() array([[[-1, 0, 5, 3, 0]]]) >>> raster.asMask().array() array([[[0, 1, 1, 1, 1]]], dtype=uint8)
-
convolve(filename, kernel, **kwargs)[source]¶ Perform convolution of itself with the given
kerneland return the result raster, where an 1D kernel is applied along the z dimension, an 2D kernel is applied spatially (i.e. y/x dimensions), and an 3D kernel is applied directly to the 3D z-y-x data cube.Parameters: - filename (str) – output path
- kernel (astropy.convolution.kernels.Kernel) –
- kwargs – passed to
hubflow.core.Applier
Return type: Example: >>> array = np.zeros(shape=[1, 5, 5]) >>> array[0, 2, 2] = 1 >>> raster = Raster.fromArray(array=array, filename='/vsimem/raster.bsq') >>> raster.array() array([[[ 0., 0., 0., 0., 0.], [ 0., 0., 0., 0., 0.], [ 0., 0., 1., 0., 0.], [ 0., 0., 0., 0., 0.], [ 0., 0., 0., 0., 0.]]])
>>> from astropy.convolution.kernels import Kernel2D
>>> kernel = Kernel2D(array=np.ones(shape=[3, 3]))
>>> kernel.array
array([[ 1.,  1.,  1.],
       [ 1.,  1.,  1.],
       [ 1.,  1.,  1.]])
>>> result = raster.convolve(filename='/vsimem/result.bsq', kernel=kernel)
>>> result.array()
array([[[ 0.,  0.,  0.,  0.,  0.],
        [ 0.,  1.,  1.,  1.,  0.],
        [ 0.,  1.,  1.,  1.,  0.],
        [ 0.,  1.,  1.,  1.,  0.],
        [ 0.,  0.,  0.,  0.,  0.]]], dtype=float32)
-
classmethod
fromArray(array, filename, grid=None, noDataValues=None, descriptions=None, **kwargs)[source]¶ Create instance from given
array.Parameters: - array (Union[numpy.ndarray, list]) –
- filename (str) – output path
- grid (hubdc.core.Grid) – output grid
- noDataValues (List[float]) – list of band no data values
- descriptions (List[str]) – list of band descriptions (i.e. band names)
- kwargs – passed to constructor (e.g. Raster, Classification, Regression, …)
Return type: Example: >>> raster = Raster.fromArray(array=np.zeros(shape=[177, 100, 100]), filename='/vsimem/raster.bsq') >>> raster.shape() (177, 100, 100) >>> raster.grid() # default grid uses WGS84 projection and millisecond (1/3600 degree) resolution Grid(extent=Extent(xmin=0.0, xmax=0.027777777777777776, ymin=0.0, ymax=0.027777777777777776), resolution=Resolution(x=0.0002777777777777778, y=0.0002777777777777778), projection=Projection(wkt=GEOGCS["WGS84", DATUM["WGS_1984", SPHEROID["WGS84",6378137,298.257223563, AUTHORITY["EPSG","7030"]], AUTHORITY["EPSG","6326"]], PRIMEM["Greenwich",0, AUTHORITY["EPSG","8901"]], UNIT["degree",0.0174532925199433, AUTHORITY["EPSG","9122"]], AUTHORITY["EPSG","4326"]])
-
static
fromEnviSpectralLibrary(filename, library)[source]¶ Create instance from given
library.Parameters: - filename (str) – output path
- library (EnviSpectralLibrary`) –
Return type: Example: >>> import enmapboxtestdata >>> speclib = EnviSpectralLibrary(filename=enmapboxtestdata.speclib) >>> raster = Raster.fromEnviSpectralLibrary(filename='/vsimem/raster.bsq', library=speclib) >>> raster.shape() (177, 75, 1)
-
classmethod
fromRasterDataset(rasterDataset, **kwargs)[source]¶ Create instance from given
rasterDataset.Parameters: - rasterDataset (hubdc.core.RasterDataset) – existing hubdc.core.RasterDataset
- kwargs – passed to class constructor
Return type: Example: >>> rasterDataset = RasterDataset.fromArray(array=[[[1,2,3]]], filename='/vsimem/raster.bsq', driver=EnviBsqDriver()) >>> rasterDataset # doctest: +ELLIPSIS RasterDataset(gdalDataset=<osgeo.gdal.Dataset; proxy of <Swig Object of type 'GDALDatasetShadow *' at 0x...> >) >>> Raster.fromRasterDataset(rasterDataset=rasterDataset) Raster(filename=/vsimem/raster.bsq)
-
classmethod
fromVector(filename, vector, grid, noDataValue=None, **kwargs)[source]¶ Create instance from given
vectorby rasterizing it into the givengrid.Parameters: - filename (str) – output path
- vector (Vector) – input vector
- grid (hubdc.core.Grid) – output pixel grid
- noDataValue (float) – output no data value
- kwargs – passed to
hubflow.core.Applier
Return type: Example: >>> import tempfile >>> vector = Vector.fromPoints(points=[(-1, -1), (1, 1)], filename=join(tempfile.gettempdir(), 'vector.shp'), projection=Projection.wgs84()) >>> grid = Grid(extent=Extent(xmin=-1.5, xmax=1.5, ymin=-1.5, ymax=1.5), resolution=1, projection=Projection.wgs84()) >>> raster = Raster.fromVector(filename='/vsimem/raster.bsq', vector=vector, grid=grid) >>> print(raster.array()) [[[ 0. 0. 1.] [ 0. 0. 0.] [ 1. 0. 0.]]]
-
metadataFWHM(required=False)[source]¶ Return list of band full width at half maximums in nanometers. If not defined, list entries are
None.Example: >>> import enmapboxtestdata >>> Raster(filename=enmapboxtestdata.enmap).metadataFWHM() # doctest: +ELLIPSIS [5.8, 5.8, 5.8, ..., 9.1, 9.1, 9.1]
-
metadataWavelength()[source]¶ Return list of band center wavelengths in nanometers.
Example: >>> import enmapboxtestdata >>> Raster(filename=enmapboxtestdata.enmap).metadataWavelength() # doctest: +ELLIPSIS [460.0, 465.0, 470.0, ..., 2393.0, 2401.0, 2409.0]
-
resample(filename, grid, resampleAlg=<sphinx.ext.autodoc.importer._MockObject object>, **kwargs)[source]¶ Return itself resampled into the given
grid.Parameters: - filename (str) – output path
- grid (hubdc.core.Grid) –
- resampleAlg (int) – GDAL resampling algorithm
- kwargs – passed to
hubflow.core.Applier
Return type: Example: >>> raster = Raster.fromArray(array=[[[1, 2, 3]]], filename='/vsimem/raster.bsq') >>> raster.array() array([[[1, 2, 3]]]) >>> grid = Grid(extent=raster.grid().extent(), ... resolution=raster.grid().resolution() / (2, 1)) >>> result = raster.resample(filename='/vsimem/result.bsq', grid=grid) >>> result.array() array([[[1, 1, 2, 2, 3, 3]]])
-
saveAs(filename, driver=None, copyMetadata=True, copyCategories=True)[source]¶ Save copy of self at given
filename. Format will be derived from filename extension if not explicitely specified bydriverkeyword.
-
scatterMatrix(raster2, bandIndex1, bandIndex2, range1, range2, bins=256, mask=None, stratification=None, **kwargs)[source]¶ Return scatter matrix between itself’s band given by
bandIndex1andraster2’s band given bybandIndex2stored as a named tupleScatterMatrix(H, xedges, yedges). WhereHis the 2d count matrix for the binning given byxedgesandyedgeslists. If astraticationis defined,Hwill be a list of 2d count matrices, one for each strata.Parameters: - raster2 (Raster) –
- bandIndex1 (int) – first band index
- bandIndex2 (int) – second band index
- range1 (Tuple[float, float]) – first band range as (min, max) tuple
- range2 (Tuple[float, float]) – second band range as (min, max) tuple
- bins – passed to
np.histogram2d - mask (Map) – map that is evaluated as a mask
- stratification (Classification) – classification that stratifies the calculation into different classes
- kwargs – passed to
hubflow.core.Applier
Return type: ScatterMatrix(H, xedges, yedges)
Example: >>> # create two single band raster >>> raster1 = Raster.fromArray(array=[[[1, 2, 3]]], filename='/vsimem/raster1.bsq') >>> raster2 = Raster.fromArray(array=[[[10, 20, 30]]], filename='/vsimem/raster2.bsq') >>> # calculate scatter matrix between both raster bands >>> scatterMatrix = raster1.scatterMatrix(raster2=raster2, bandIndex1=0, bandIndex2=0, range1=[1, 4], range2=[10, 40], bins=3) >>> scatterMatrix.H array([[1, 0, 0], [0, 1, 0], [0, 0, 1]], dtype=uint64) >>> scatterMatrix.xedges array([ 1., 2., 3., 4.]) >>> scatterMatrix.yedges array([ 10., 20., 30., 40.])
-
sensorDefinition()[source]¶ Return
SenserDefinitioncreated from center wavelength and FWHM.Example: >>> SensorDefinition.predefinedSensorNames() ['modis', 'moms', 'mss', 'npp_viirs', 'pleiades1a', 'pleiades1b', 'quickbird', 'rapideye', 'rasat', 'seawifs', 'sentinel2', 'spot', 'spot6', 'tm', 'worldview1', 'worldview2', 'worldview3'] >>> SensorDefinition.fromPredefined('sentinel2') # doctest: +ELLIPSIS, +NORMALIZE_WHITESPACE SensorDefinition(wavebandDefinitions=[WavebandDefinition(center=443.0, fwhm=None, responses=[...], name=Sentinel-2 - Band B1), ..., WavebandDefinition(center=2196.5, fwhm=None, responses=[...], name=Sentinel-2 - Band B12)])
-
statistics(bandIndices=None, mask=None, calcPercentiles=False, calcHistogram=False, calcMean=False, calcStd=False, percentiles=[], histogramRanges=None, histogramBins=None, **kwargs)[source]¶ Return a list of BandStatistic named tuples:
key value/description index band index nvalid number of valid pixel (not equal to noDataValue and not masked) ninvalid number of invalid pixel (equal to noDataValue or masked) min smallest value max largest value percentiles+ list of (rank, value) tuples for given percentiles std+ standard deviation mean+ mean histo+ Histogram(hist, bin_edges) tuple with histogram counts and bin edges +set corresponding calcPercentiles/Histogram/Mean/Std keyword to True
Parameters: - bandIndices (Union[None, None, None]) – calculate statistics only for given
bandIndices - mask (Union[None, None, None]) –
- calcPercentiles (bool) – if set True, band percentiles are calculated; see
percentileskeyword - calcHistogram (bool) – if set True, band histograms are calculated; see
histogramRangesandhistogramBinskeywords - calcMean (bool) – if set True, band mean values are calculated
- calcStd (bool) – if set True, band standard deviations are calculated
- percentiles (List[float]) – values between 0 (i.e. min value) and 100 (i.e. max value), 50 is the median
- histogramRanges (List[numpy.histogram ranges]) – list of ranges, one for each band; ranges are passed to
numpy.histogram; None ranges are set to (min, max) - histogramBins (List[numpy.histogram bins]) – list of bins, one for each band; bins are passed to
numpy.histogram; None bins are set to 256 - kwargs – passed to
hubflow.core.Applier
Return type: List[BandStatistics(index, nvalid, ninvalid, min, max, percentiles, std, mean, histo)]
Example: >>> # create raster with no data values >>> raster = Raster.fromArray(array=[[[1, np.nan, 3], [0, 2, np.inf], [1, 0, 3]]], filename='/vsimem/raster.bsq', noDataValues=[0]) >>> # calculate basic statistics >>> statistics = raster.statistics() >>> print(statistics[0]) BandStatistics(index=0, nvalid=5, ninvalid=4, min=1.0, max=3.0, percentiles=None, std=None, mean=None, histo=None) >>> # calculate histograms >>> statistics = raster.statistics(calcHistogram=True, histogramRanges=[(1, 4)], histogramBins=[3]) >>> print(statistics[0].histo) Histogram(hist=array([2, 1, 2], dtype=int64), bin_edges=array([ 1., 2., 3., 4.])) >>> # calculate percentiles (min, median, max) >>> statistics = raster.statistics(calcPercentiles=True, percentiles=[0, 50, 100]) >>> print(statistics[0].percentiles) [Percentile(rank=0, value=1.0), Percentile(rank=50, value=2.0), Percentile(rank=100, value=3.0)]
- bandIndices (Union[None, None, None]) – calculate statistics only for given
-
subsetBands(filename, indices, invert=False, **kwargs)[source]¶ Return the band subset given by
indices.Parameters: - filename (str) – output path
- indices (list) –
- invert (bool) – wether to invert the indices list (i.e. dropping bands instead of selecting)
- kwargs (dict) – passed to gdal.Translate
Return type: Example: TODO
>>> raster = Raster.fromArray(array=[[[1]], [[2]], [[3]]], filename='/vsimem/raster.bsq')
>>> raster.array()
array([[[1, 2, 3]]])
-
Mask
-
class
hubflow.core.Mask(filename, noDataValues=None, minOverallCoverage=0.5, indices=None, invert=False)[source]¶ Bases:
hubflow.core.Raster-
static
fromRaster(filename, raster, initValue=False, true=(), false=(), invert=False, aggregateFunction=None, **kwargs)[source]¶ Returns a mask created from a raster map, where given lists of
trueandfalsevalues and value ranges are used to define True and False regions.Parameters: - filename – output path
- raster (hubflow.core.Raster) – input raster
- initValue (bool) – initial fill value, default is False
- true (List[number or range]) – list of forground numbers and ranges
- false (List[number or range]) – list of forground numbers and ranges
- invert (bool) – whether to invert the mask
- aggregateFunction (func) – aggregation function (e.g. numpy.all or numpy.any) to reduce multiband rasters to a single band mask; the default is to not reduce and returning a multiband mask
- kwargs – passed to hubflow.core.Applier
Returns: hubflow.core.Mask
Return type: Example: >>> raster = Raster.fromArray(array=[[[-99, 1, 2, 3, 4, 5]]], filename='/vsimem/raster.bsq') >>> raster.array() array([[[-99, 1, 2, 3, 4, 5]]]) >>> # values 1, 2, 3 are True >>> Mask.fromRaster(raster=raster, true=[1, 2, 3], filename='/vsimem/mask.bsq').array() array([[[0, 1, 1, 1, 0, 0]]], dtype=uint8) >>> # value range 1 to 4 is True >>> Mask.fromRaster(raster=raster, true=[range(1, 4)], filename='/vsimem/mask.bsq').array() array([[[0, 1, 1, 1, 1, 0]]], dtype=uint8) >>> # all values are True, but -99 >>> Mask.fromRaster(raster=raster, initValue=True, false=[-99], filename='/vsimem/mask.bsq').array() array([[[0, 1, 1, 1, 1, 1]]], dtype=uint8)
Different aggregations over multiple bands
>>> raster = Raster.fromArray(array=[[[0, 0, 1, 1]], [[0, 1, 0, 1]]], filename='/vsimem/raster.bsq')
>>> raster.array()
array([[[0, 0, 1, 1]],
<BLANKLINE>
       [[0, 1, 0, 1]]])
>>> # no aggregation
>>> Mask.fromRaster(raster=raster, true=[1], filename='/vsimem/mask.bsq').readAsArray()
array([[[0, 0, 1, 1]],
<BLANKLINE>
       [[0, 1, 0, 1]]], dtype=uint8)
>>> # True if all pixel profile values are True
>>> def aggregate(array): return np.all(array, axis=0)
>>> Mask.fromRaster(raster=raster, true=[1], aggregateFunction=aggregate, filename='/vsimem/mask.bsq').readAsArray()
array([[[0, 0, 0, 1]]], dtype=uint8)
>>> # True if any pixel profile values are True
>>> def aggregate(array): return np.any(array, axis=0)
>>> Mask.fromRaster(raster=raster, true=[1], aggregateFunction=aggregate, filename='/vsimem/mask.bsq').readAsArray()
array([[[0, 1, 1, 1]]], dtype=uint8)
-
static
fromVector(filename, vector, grid, **kwargs)[source]¶ Create a mask from a vector.
Parameters: - filename – output path
- vector (hubflow.core.Vector) – input vector
- grid (hubdc.core.Grid) –
- kwargs –
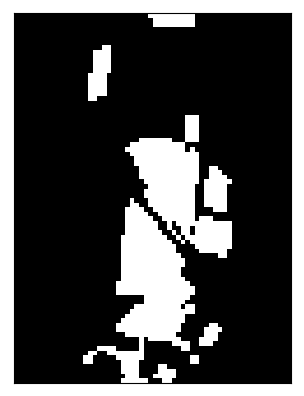
Returns: Return type: Example: >>> import enmapboxtestdata >>> vector = Vector(filename=enmapboxtestdata.landcover, initValue=0) >>> grid = Raster(filename=enmapboxtestdata.enmap).grid() >>> mask = Mask.fromVector(filename='/vsimem/mask.bsq', vector=vector, grid=grid) >>> plotWidget = mask.plotSinglebandGrey()
-
resample(filename, grid, **kwargs)[source]¶ Returns a resampled mask of itself into the given
grid.Parameters: - filename (str) – output path
- grid (hubdc.core.Grid) – output grid
- kwargs – passed to hubflow.core.Applier
Returns: Return type: Example: >>> mask = Mask.fromArray(array=[[[0, 1]]], filename='/vsimem/mask.bsq') >>> grid = Grid(extent=mask.grid().extent(), resolution=mask.grid().resolution().zoom(factor=(2, 1))) >>> mask.resample(grid=grid, filename='/vsimem/resampled.bsq').array() array([[[0, 0, 1, 1]]], dtype=uint8)
-
static
Classification
-
class
hubflow.core.Classification(filename, classDefinition=None, minOverallCoverage=0.5, minDominantCoverage=0.5, eAccess=<sphinx.ext.autodoc.importer._MockObject object>)[source]¶ Bases:
hubflow.core.RasterClass for managing classifications.
-
classmethod
fromArray(array, filename, classDefinition=None, grid=None, **kwargs)[source]¶ Create instance from given
array.Parameters: - array (numpy.ndarray) – input array of shape (1, lines, sample)
- filename (str) – output path
- classDefinition (hubflow.core.ClassDefinition) –
- grid (hubdc.core.Grid) –
- kwargs – additional kwargs are passed to Classification contructor
Returns: Return type: Exemple: >>> Classification.fromArray(array=[[[0, 1],[1,2]]], ... filename='/vsimem/classification.bsq', ... classDefinition=ClassDefinition(colors=['red', 'blue'])) Classification(filename=/vsimem/classification.bsq, classDefinition=ClassDefinition(classes=2, names=['class 1', 'class 2'], colors=[Color(255, 0, 0), Color(0, 0, 255)]), minOverallCoverage=0.5, minDominantCoverage=0.5)
-
classmethod
fromClassification(filename, classification, grid=None, masks=None, **kwargs)[source]¶ Create instance from classification-like raster.
Parameters: - filename (str) – output path
- classification (Union[Classification, VectorClassification, Fraction]) – classification-like raster
- grid (hubdc.core.Grid) –
- masks (Mask) –
- kwargs – passed to Applier
Returns: Return type:
-
static
fromEnviSpectralLibrary(filename, library, attribute, classDefinition=None)[source]¶ Create instance from library attribute. If the ClassDefinition is not defined, it is taken from an accompanied JSON file.
Parameters: - filename – output path
- library (EnviSpectralLibrary) –
- attribute (str) – attribute defined in the corresponding csv file
- classDefinition (ClassDefinition) –
Returns: Return type: Example: >>> import enmapboxtestdata >>> library = EnviSpectralLibrary(filename=enmapboxtestdata.library) >>> Classification.fromEnviSpectralLibrary(filename='/vsimem/classification.bsq', library=library, attribute='level_1')
-
classmethod
fromFraction(filename, fraction, grid=None, masks=None, **kwargs)[source]¶ Forwarded to
fromClassification().
-
classmethod
fromRasterAndFunction(filename, raster, ufunc, classDefinition=None, **kwargs)[source]¶ Create instance from raster by applying a user-function to it.
Parameters: - filename (str) – output path
- raster (Raster) – input raster
- ufunc (function) – user-function (taking two arguments: array, metadataDict) to be applied to the raster data (see example below)
- classDefinition (ClassDefinition) –
- kwargs – passed to Applier
Returns: Return type: Example: >>> raster = Raster.fromArray(array=[[[1,2,3,4,5]]], filename='/vsimem/raster.bsq') >>> def ufunc(array, metadataDict): ... result = np.zeros_like(array) # init result with zeros ... result[array < 3] = 1 # map all values < 3 to class 1 ... result[array > 3] = 2 # map all values > 3 to class 2 ... return result >>> classification = Classification.fromRasterAndFunction(raster=raster, ufunc=ufunc, filename='/vsimem/classification.bsq') >>> classification.array() array([[[1, 1, 0, 2, 2]]], dtype=uint8)
-
reclassify(filename, classDefinition, mapping, **kwargs)[source]¶ Reclassify classes by given
mappingnewclassDefinition.Parameters: - filename (str) – output path
- classDefinition (ClassDefinition) –
- mapping (dict) –
- kwargs – passed to Applier
Returns: Return type: Example: >>> classification = Classification.fromArray(array=[[[1,2,3,4]]], filename='/vsimem/classification.bsq') >>> reclassified = classification.reclassify(filename='/vsimem/reclassified.bsq', ... classDefinition=ClassDefinition(classes=2), ... mapping={1: 0, 2: 1, 3: 1, 4: 2}) >>> reclassified.array() array([[[0, 1, 1, 2]]], dtype=uint8)
-
resample(filename, grid, **kwargs)[source]¶ Resample itself into the gives
grid.Parameters: - filename (str) – output path
- grid (hubdc.core.Grid) –
- kwargs – passed to Applier
Returns: Return type: Example: Resample into a grid with 2x finer resolution
>>> classification = Classification.fromArray(array=[[[1,2,3,4]]], filename='/vsimem/classification.bsq')
>>> classification.array()
array([[[1, 2, 3, 4]]], dtype=uint8)
>>> grid = classification.grid()
>>> grid2 = grid.atResolution(resolution=grid.resolution()/2)
>>> resampled = classification.resample(filename='/vsimem/resampled.bsq', grid=grid2)
>>> resampled.array()
array([[[1, 1, 2, 2, 3, 3, 4, 4],
        [1, 1, 2, 2, 3, 3, 4, 4]]], dtype=uint8)
-
classmethod
Fraction
-
class
hubflow.core.Fraction(filename, classDefinition=None, minOverallCoverage=0.0, minDominantCoverage=0.0)[source]¶ Bases:
hubflow.core.RegressionClass for managing fraction maps.
-
asClassColorRGBRaster(filename, **kwargs)[source]¶ Create RGB image, where the pixel color is the average of the original class colors, weighted by the pixel fractions. Regions with purer pixels (i.e. fraction of a specific class is near 1), appear in the original class colors, and regions with mixed pixels appear in mixed class colors.
Parameters: - filename – input path
- kwargs – passed to Applier
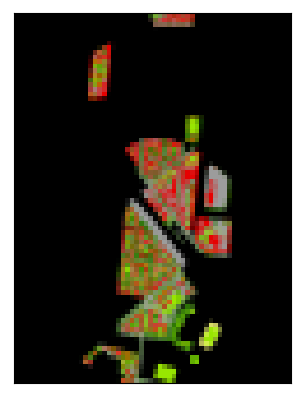
Returns: Return type: >>> import enmapboxtestdata >>> fraction = Fraction(filename=enmapboxtestdata.landcoverfractions) >>> rgb = fraction.asClassColorRGBRaster(filename='/vsimem/rgb.bsq') >>> rgb.plotMultibandColor()
-
classmethod
fromClassification(filename, classification, **kwargs)[source]¶ Create instance from given classification. A simple binarization in fractions of 0 and 1 is performed.
Parameters: - filename – output path
- classification (Classification) – input classification
- kwargs – passed to Applier
Returns: Fraction
Return type: Example: >>> classification = Classification.fromArray(array=[[[1, 2, 3]]], filename='/vsimem/classification.bsq') >>> classification.array() array([[[1, 2, 3]]], dtype=uint8) >>> fraction = Fraction.fromClassification(classification=classification, filename='/vsimem/fraction.bsq') >>> fraction.array() array([[[ 1., 0., 0.]], <BLANKLINE> [[ 0., 1., 0.]], <BLANKLINE> [[ 0., 0., 1.]]], dtype=float32)
-
resample(filename, grid, **kwargs)[source]¶ Resample itself into the given grid using gdal.GRA_Average resampling.
Parameters: - filename – output path
- grid (hubdc.core.Grid) –
- kwargs – passed to Applier
Returns: Return type: Example: Resample into grid that is 2x as fine.
>>> fraction = Fraction.fromArray(array=[[[0., 0.5, 1.]],
...                                     [[1., 0.5, 1.]]],
...                               filename='/vsimem/fraction.bsq')
>>> fraction.array()
array([[[ 0. ,  0.5,  1. ]],
<BLANKLINE>
       [[ 1. ,  0.5,  1. ]]])
>>> grid = fraction.grid()
>>> grid2 = grid.atResolution(grid.resolution()/(2, 1)) # change only resolution in x dimension
>>> resampled = fraction.resample(grid=grid2, filename='/vsimem/resampled.bsq')
>>> resampled.array()
array([[[ 0. ,  0. ,  0.5,  0.5,  1. ,  1. ]],
<BLANKLINE>
       [[ 1. ,  1. ,  0.5,  0.5,  1. ,  1. ]]])
-
subsetClasses(filename, labels, **kwargs)[source]¶ Subset itself by given class labels.
Parameters: - filename – input path
- labels – list of labels to be subsetted
- kwargs – passed to Applier
Returns: Return type: Example: Subset 2 classes fom a fraction map with 3 classes.
>>> fraction = Fraction.fromArray(array=[[[0.0, 0.3]],
...                                      [[0.2, 0.5]],
...                                      [[0.8, 0.2]]],
...                               filename='/vsimem/fraction.bsq')
>>> fraction.array()
array([[[0. , 0.3]],
<BLANKLINE>
       [[0.2, 0.5]],
<BLANKLINE>
       [[0.8, 0.2]]])
>>> subsetted = fraction.subsetClasses(labels=[1, 3], filename='/vsimem/subsetted.bsq')
>>> subsetted.array()
array([[[0. , 0.3]],
<BLANKLINE>
       [[0.8, 0.2]]])
-
subsetClassesByName(filename, names, **kwargs)[source]¶ Subset itself by given class names.
Parameters: - filename – input path
- names – list of class names to be subsetted
- kwargs – passed to Applier
Returns: Return type: Example: Subset 2 classes fom a fraction map with 3 classes.
>>> fraction = Fraction.fromArray(array=[[[0.0, 0.3]],
...                                      [[0.2, 0.5]],
...                                      [[0.8, 0.2]]],
...                               classDefinition=ClassDefinition(names=['a', 'b', 'c']),
...                               filename='/vsimem/fraction.bsq')
>>> fraction.classDefinition().names()
['a', 'b', 'c']
>>> fraction.array()
array([[[0. , 0.3]],
<BLANKLINE>
       [[0.2, 0.5]],
<BLANKLINE>
       [[0.8, 0.2]]])
>>> subsetted = fraction.subsetClassesByName(names=['a', 'c'], filename='/vsimem/subsetted.bsq')
>>> subsetted.classDefinition().names()
['a', 'c']
>>> subsetted.array()
array([[[0. , 0.3]],
<BLANKLINE>
       [[0.8, 0.2]]])
-
Regression
-
class
hubflow.core.Regression(filename, noDataValues=None, outputNames=None, minOverallCoverage=0.5)[source]¶ Bases:
hubflow.core.RasterClass for managing regression maps.
-
asMask(minOverallCoverage=None, noDataValues=None)[source]¶ Creates a mask instance from itself. Optionally, the minimal overall coverage can be changed.
-
noDataValues(default=None, required=True)[source]¶ Return no data values.
Example: >>> import enmapboxtestdata >>> Regression(filename=enmapboxtestdata.landcoverfractions).noDataValues() [-1.0, -1.0, -1.0, -1.0, -1.0, -1.0]
-
outputNames()[source]¶ Return output names.
Example: >>> import enmapboxtestdata >>> Regression(filename=enmapboxtestdata.landcoverfractions).outputNames() ['Roof', 'Pavement', 'Low vegetation', 'Tree', 'Soil', 'Other']
-
outputs()[source]¶ Return number of outputs (i.e. number of bands).
Example: >>> import enmapboxtestdata >>> Regression(filename=enmapboxtestdata.landcoverfractions).outputs() 6
-
resample(filename, grid, **kwargs)[source]¶ Resample itself into the given grid using gdal.GRA_Average resampling.
Parameters: - filename – output filename
- grid – hubdc.core.Grid
- kwargs – passed to Applier
Returns: Regression
Return type: Example: Resample into a grid that is 1.5x as fine.
>>> regression = Regression.fromArray([[[0., 0.5, 1.]]], noDataValues=[-1], filename='/vsimem/regression.bsq')
>>> regression.array()
array([[[ 0. ,  0.5,  1. ]]])
>>> grid = regression.grid()
>>> grid2 = grid.atResolution(resolution=grid.resolution() / 2)
>>> resampled = regression.resample(grid=grid2, filename='/vsimem/resampled.bsq')
>>> resampled.array()
array([[[ 0. ,  0. ,  0.5,  0.5,  1. ,  1. ],
        [ 0. ,  0. ,  0.5,  0.5,  1. ,  1. ]]])
-
Vector Maps
Vector
-
class
hubflow.core.Vector(filename, layer=0, initValue=0, burnValue=1, burnAttribute=None, allTouched=False, filterSQL=None, dtype=<sphinx.ext.autodoc.importer._MockObject object>, noDataValue=None)[source]¶ Bases:
hubflow.core.MapClass for managing vector maps. See also
VectorMask,VectorClassification-
extent()[source]¶ Returns the spatial extent.
Example: >>> import enmapboxtestdata >>> Vector(filename=enmapboxtestdata.landcover).extent() # doctest: +ELLIPSIS SpatialExtent(xmin=383918.24389999924, xmax=384883.2196000004, ymin=5815685.854300001, ymax=5818407.0616999995, projection=Projection(wkt=PROJCS["WGS_1984_UTM_Zone_33N", GEOGCS["GCS_WGS_1984", DATUM["WGS_1984", SPHEROID["WGS_84",6378137,298.257223563]], PRIMEM["Greenwich",0], UNIT["Degree",0.017453292519943295], AUTHORITY["EPSG","4326"]], ..., AUTHORITY["EPSG","32633"]]))
-
classmethod
fromPoints(filename, points)[source]¶ Create instance from given points. Projection of first point is used.
Example: >>> vector = Vector.fromPoints(points=[(-1, -1), (1, 1)], filename=join(tempfile.gettempdir(), 'vector.shp')) >>> grid = Grid(extent=Extent(xmin=-1.5, xmax=1.5, ymin=-1.5, ymax=1.5), resolution=1, projection=Projection.wgs84()) >>> raster = Raster.fromVector(filename='/vsimem/raster.bsq', vector=vector, grid=grid) >>> raster.array() array([[[ 0., 0., 1.], [ 0., 0., 0.], [ 1., 0., 0.]]], dtype=float32)
-
classmethod
fromRandomPointsFromClassification(filename, classification, n, **kwargs)[source]¶ Draw stratified random locations from raster classification and return as point vector.
Parameters: - filename (str) – output path
- classification – input classification used as stratification
- n (List[int]) – list of number of points, one for each class
- kwargs – passed to hubflow.core.Applier
Returns: Return type: Example: Create classification from landcover polygons, …
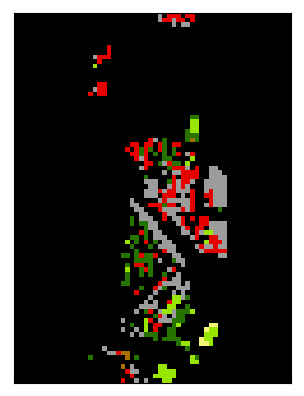
>>> import enmapboxtestdata
>>> grid = Raster(filename=enmapboxtestdata.enmap).grid()
>>> vectorClassification = VectorClassification(filename=enmapboxtestdata.landcover,
...                                             classAttribute=enmapboxtestdata.landcoverAttributes.Level_2_ID,
...                                             classDefinition=ClassDefinition(colors=enmapboxtestdata.landcoverClassDefinition.level2.lookup),
...                                             oversampling=5)
>>> classification = Classification.fromClassification(filename='/vsimem/classification.bsq', classification=vectorClassification, grid=grid)
>>> classification.plotCategoryBand()
… draw 10 random locations from each class, …
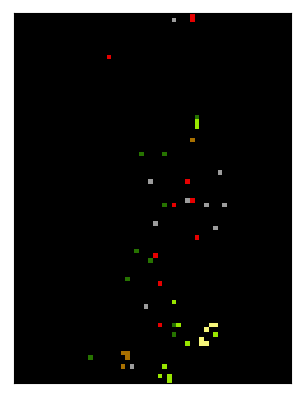
>>> points = Vector.fromRandomPointsFromClassification(classification=classification, n=[10]*6, filename=join(tempfile.gettempdir(), 'vector.shp'))
… apply those points as mask to the original classification
>>> labels = classification.applyMask(filename='/vsimem/labels.bsq', mask=points)
>>> labels.plotCategoryBand()
-
classmethod
fromRandomPointsFromMask(filename, mask, n, **kwargs)[source]¶ Draw random locations from raster mask and return as point vector.
Parameters: - filename (str) – output path
- mask (hubflow.core.Mask) – input mask
- n (int) – number of points
- kwargs – passed to hubflow.core.Applier
Returns: Return type: Example: Create a mask, …
>>> import enmapboxtestdata
>>> grid = Raster(filename=enmapboxtestdata.enmap).grid()
>>> mask = Mask.fromVector(filename='/vsimem/mask.bsq',
...                        vector=Vector(filename=enmapboxtestdata.landcover), grid=grid)
>>> mask.plotSinglebandGrey()
… draw 10 random locations, …
>>> points = Vector.fromRandomPointsFromMask(mask=mask, n=10, filename=join(tempfile.gettempdir(), 'vector.shp'))
… and rasterize the result into the grid of the mask.
>>> Mask.fromVector(filename='/vsimem/mask.bsq', vector=points, grid=grid).plotSinglebandGrey()
-
classmethod
fromVectorDataset(vectorDataset, **kwargs)[source]¶ Create instance from
vectorDataset. Additionalkwargsare passed to the contructor.Example: >>> import enmapboxtestdata >>> vectorDataset = Vector(filename=enmapboxtestdata.landcover).dataset() >>> Vector.fromVectorDataset(vectorDataset=vectorDataset) # doctest: +ELLIPSIS, +NORMALIZE_WHITESPACE Vector(filename=...LandCov_BerlinUrbanGradient.shp, layer=0, initValue=0, burnValue=1, burnAttribute=None, allTouched=False, filterSQL=None, dtype=<class 'numpy.float32'>, noDataValue=None)
-
grid(resolution)[source]¶ Returns the grid for the given
resolution.Example: >>> import enmapboxtestdata >>> Vector(filename=enmapboxtestdata.landcover).grid(resolution=30) # doctest: +ELLIPSIS, +NORMALIZE_WHITESPACE Grid(extent=Extent(xmin=383918.24389999924, xmax=384878.24389999924, ymin=5815685.854300001, ymax=5818415.854300001), resolution=Resolution(x=30.0, y=30.0), projection=Projection(wkt=PROJCS["WGS_1984_UTM_Zone_33N", GEOGCS["GCS_WGS_1984", DATUM["WGS_1984", SPHEROID["WGS_84",6378137,298.257223563]], PRIMEM["Greenwich",0], UNIT["Degree",0.017453292519943295], AUTHORITY["EPSG","4326"]], ..., AUTHORITY["EPSG","32633"]])
-
metadataItem(key, domain='', dtype=<class 'str'>, required=False, default=None)[source]¶ Returns the value (casted to a specific
dtype) of a metadata item.
-
projection()[source]¶ Returns the projection.
Example: >>> import enmapboxtestdata >>> Vector(filename=enmapboxtestdata.landcover).projection() # doctest: +ELLIPSIS Projection(wkt=PROJCS["WGS_1984_UTM_Zone_33N", GEOGCS["GCS_WGS_1984", DATUM["WGS_1984", SPHEROID["WGS_84",6378137,298.257223563]], PRIMEM["Greenwich",0], UNIT["Degree",0.017453292519943295], AUTHORITY["EPSG","4326"]], PROJECTION["Transverse_Mercator"], PARAMETER["latitude_of_origin",0], PARAMETER["central_meridian",15], PARAMETER["scale_factor",0.9996], PARAMETER["false_easting",500000], PARAMETER["false_northing",0], UNIT["Meter",1], AUTHORITY["EPSG","32633"]])
-
uniqueValues(attribute, spatialFilter=None)[source]¶ Return unique values for given attribute.
Parameters: - attribute (str) –
- spatialFilter (hubdc.core.Geometry) – optional spatial filter
Returns: Return type: List
Example: >>> import enmapboxtestdata >>> vector = Vector(filename=enmapboxtestdata.landcover) >>> vector.uniqueValues(attribute=enmapboxtestdata.landcoverAttributes.Level_2) ['Low vegetation', 'Other', 'Pavement', 'Roof', 'Soil', 'Tree']
>>> spatialFilter = SpatialExtent(xmin=384000, xmax=384800,
...                               ymin=5818000, ymax=5819000,
...                               projection=vector.projection()).geometry()
>>> spatialFilter # doctest: +ELLIPSIS
SpatialGeometry(wkt='POLYGON ((384000 5819000 0,384800 5819000 0,384800 5818000 0,384000 5818000 0,384000 5819000 0))', projection=Projection(wkt=PROJCS["WGS_1984_UTM_Zone_33N", ..., AUTHORITY["EPSG","32633"]]))
>>> vector.uniqueValues(attribute=enmapboxtestdata.landcoverAttributes.Level_2,
...                     spatialFilter=spatialFilter)
['Low vegetation', 'Pavement', 'Roof', 'Tree']
-
VectorMask
VectorClassification
-
class
hubflow.core.VectorClassification(filename, classAttribute, classDefinition=None, layer=0, minOverallCoverage=0.5, minDominantCoverage=0.5, dtype=<sphinx.ext.autodoc.importer._MockObject object>, oversampling=1)[source]¶ Bases:
hubflow.core.VectorClass for manaing vector classifications.
Samples
Sample
-
class
hubflow.core.Sample(raster, mask=None, grid=None)[source]¶ Bases:
hubflow.core.MapCollectionClass for managing unsupervised samples.
-
extractAsArray(grid=None, masks=None, onTheFlyResampling=False, **kwargs)[source]¶ Extract profiles from raster as array
Parameters: - grid (Grid) – optional grid for on-the-fly resampling
- masks (List[Map]) – list of masks instead of self.masks()
- onTheFlyResampling (bool) – whether to allow on-the-fly resampling
- kwargs – passed to Applier
Returns: Return type: Example: >>> sample = Sample(raster=Raster.fromArray(array=[[[1, 2, 3]], ... [[1, 2, 3]]], ... filename='/vsimem/fraction.bsq'), ... mask=Mask.fromArray(array=[[[1, 0, 1]]], ... filename='/vsimem/mask.bsq')) >>> sample.extractAsArray()[0] array([[1, 3], [1, 3]])
-
extractAsRaster(filenames, grid=None, masks=None, onTheFlyResampling=False, **kwargs)[source]¶ Performes
extractAsArray()and stores the result as raster.
-
ClassificationSample
-
class
hubflow.core.ClassificationSample(raster, classification, mask=None, grid=None)[source]¶ Bases:
hubflow.core.SampleClass for managing classification samples.
RegressionSample
MapCollection
-
class
hubflow.core.MapCollection(maps)[source]¶ Bases:
hubflow.core.FlowObjectClass for managing a collection of
Map‘s.-
extractAsArray(masks, grid=None, onTheFlyResampling=False, **kwargs)[source]¶ Returns a list of arrays, one for each map in the collection. Each array holds the extracted profiles for all pixels, where all maps inside
masksevaluate toTrue.Parameters: - masks (List[Map]) – List of maps that are evaluated as masks.
- grid (hubdc.core.Grid) – If set to
None, all pixel grids in the collection and inmasksmust match. If set to a valid Grid andonTheFlyResampling=True, all maps and masks are resampled. - onTheFlyResampling (bool) – If set to
True, all maps and masks are resampled into the givengrid. - kwargs – passed to
hubflow.core.Applier
Returns: list of 2d arrays of size (bands, profiles)
Return type: List[numpy.ndarray]
Example: >>> raster = Raster.fromArray(array=[[[1, 2], [3, 4]],[[1, 2], [3, 4]]], filename='/vsimem/raster.bsq') >>> raster.array() array([[[1, 2], [3, 4]], <BLANKLINE> [[1, 2], [3, 4]]]) >>> mask = Mask.fromArray(array=[[[1, 0], [0, 1]]], filename='/vsimem/mask.bsq') >>> mask.array() array([[[1, 0], [0, 1]]], dtype=uint8) >>> mapCollection = MapCollection(maps=[raster]) >>> mapCollection.extractAsArray(masks=[mask]) [array([[1, 4], [1, 4]])]
-
extractAsRaster(filenames, masks, grid=None, onTheFlyResampling=False, **kwargs)[source]¶ Returns the result of
extractAsArray()as a list ofMapobjects.Parameters: filenames (List[str]) – list of output paths, one for each map inside the collection Return type: List[Map] All other parameters are passed to
extractAsArray().Example: Same example as in
extractAsArray().>>> raster = Raster.fromArray(array=[[[1, 2], [3, 4]],[[1, 2], [3, 4]]], filename='/vsimem/raster.bsq') >>> raster.array() array([[[1, 2], [3, 4]], <BLANKLINE> [[1, 2], [3, 4]]]) >>> mask = Mask.fromArray(array=[[[1, 0], [0, 1]]], filename='/vsimem/mask.bsq') >>> mask.array() array([[[1, 0], [0, 1]]], dtype=uint8) >>> mapCollection = MapCollection(maps=[raster]) >>> extractedRaster = mapCollection.extractAsRaster(filenames=['/vsimem/rasterExtracted.bsq'], masks=[mask]) >>> extractedRaster[0].array() array([[[1], [4]], <BLANKLINE> [[1], [4]]])
-
Estimators
Classifier
-
class
hubflow.core.Classifier(sklEstimator, sample=None)[source]¶ Bases:
hubflow.core.Estimator-
PREDICT_TYPE¶ alias of
Classification
-
SAMPLE_TYPE¶ alias of
ClassificationSample
-
fit(sample)
-
predict(filename, raster, mask=None, **kwargs)
-
predictProbability(filename, raster, mask=None, mask2=None, **kwargs)
-
Regressor
-
class
hubflow.core.Regressor(sklEstimator, sample=None)[source]¶ Bases:
hubflow.core.Estimator-
PREDICT_TYPE¶ alias of
Regression
-
SAMPLE_TYPE¶ alias of
RegressionSample
-
fit(sample)
-
predict(filename, raster, mask=None, **kwargs)
-
Clusterer
Accuracy Assessment
ClassificationPerformance
RegressionPerformance
FractionPerformance
-
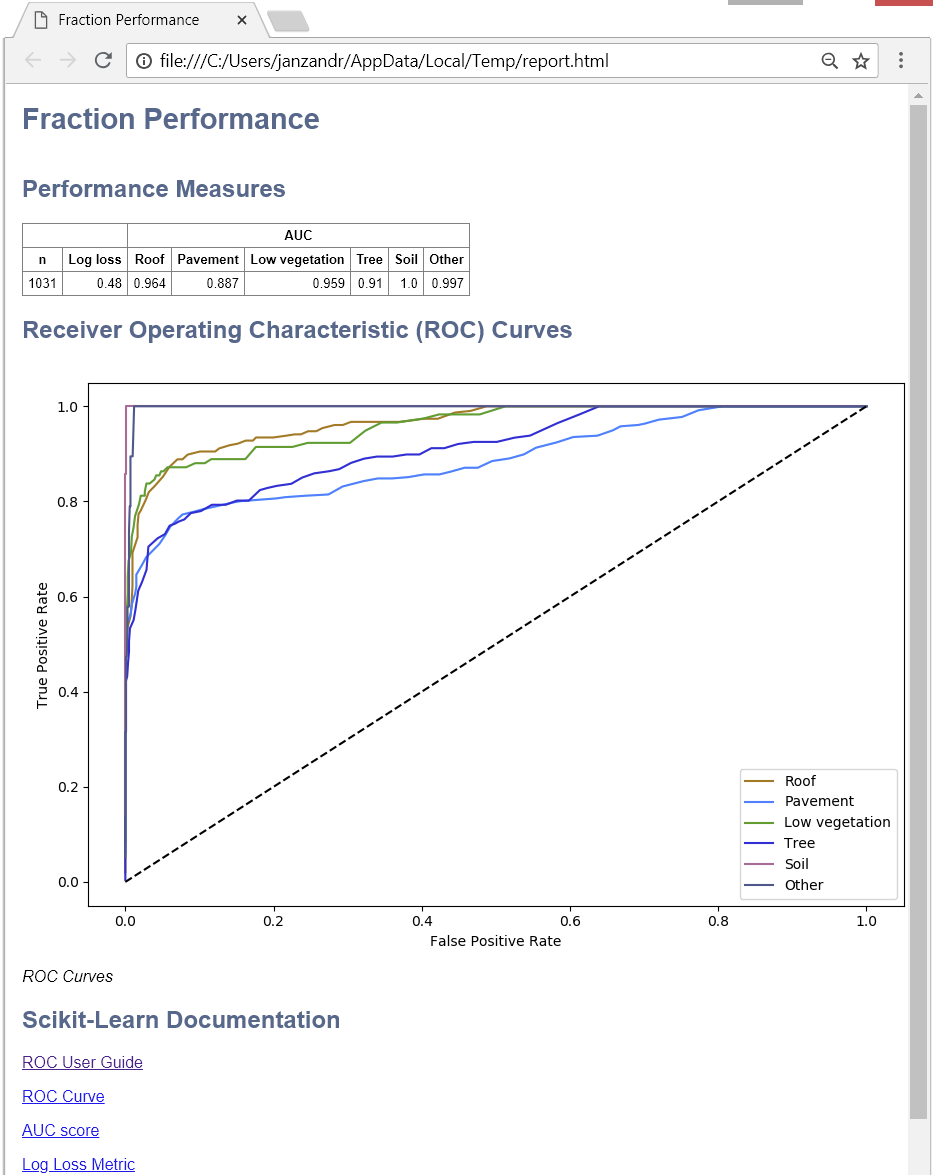
class
hubflow.core.FractionPerformance(yP, yT, classDefinitionP, classDefinitionT)[source]¶ Bases:
hubflow.core.FlowObjectClass for performing ROC curve analysis.
-
classmethod
fromRaster(prediction, reference, mask=None, **kwargs)[source]¶ Parameters: - prediction (Fraction) –
- reference (Classification) –
- mask (Mask) –
- kwargs – passed to Applier
Returns: Return type: Example: >>> import enmapboxtestdata >>> performance = FractionPerformance.fromRaster(prediction=Fraction(filename=enmapboxtestdata.landcoverfractions), ... reference=Classification(filename=enmapboxtestdata.landcoverclassification)) >>> performance.log_loss 0.4840965149878993 >>> performance.roc_auc_scores {1: 0.9640992638757171, 2: 0.8868830628381189, 3: 0.9586349099478203, 4: 0.9102916036557301, 5: 0.9998604910714286, 6: 0.9966195132099022} >>> performance.report().saveHTML(filename=join(tempfile.gettempdir(), 'report.html'), open=True)
-
classmethod
Miscellaneous
ClassDefinition
-
class
hubflow.core.ClassDefinition(classes=None, names=None, colors=None)[source]¶ Bases:
hubflow.core.FlowObjectClass for managing class definitions.
-
colorsFlatRGB()[source]¶ Return colors as flat list of r, g, b values.
Example: >>> ClassDefinition(colors=['red', 'blue']).colorsFlatRGB() [255, 0, 0, 0, 0, 255]
-
dtype()[source]¶ Return the smalles unsigned integer data type suitable for the number of classes.
Example: >>> ClassDefinition(classes=10).dtype() <class 'numpy.uint8'> >>> ClassDefinition(classes=1000).dtype() <class 'numpy.uint16'>
-
static
fromArray(array)[source]¶ Create instance by deriving the number of classes from the maximum value of the array.
Example: >>> ClassDefinition.fromArray(array=[[[1, 2, 3]]]) # doctest: +ELLIPSIS ClassDefinition(classes=3, names=['class 1', 'class 2', 'class 3'], colors=[...])
-
static
fromENVIClassification(raster)[source]¶ Create instance by deriving metadata information for classes, class names and class lookup from the ENVI domain.
-
static
fromENVIFraction(raster)[source]¶ Create instance by deriving metadata information for band names and band lookup from the ENVI domain.
-
static
fromGDALMeta(raster, index=0, skipZeroClass=True)[source]¶ Create instance by deriving category names and color table from GDAL raster dataset.
-
static
fromRaster(raster)[source]¶ Create instance by trying to 1) use
fromENVIClassification(), 2) usefromGDALMeta()and finally 3) derive number of classes from raster band maximum value.
-
SensorDefinition
hubflow.core.SensorDefinition:fromENVISpectralLibrary()plot()resampleProfiles()resampleRaster()wavebandCount()wavebandDefinition()wavebandDefinitions()
-
class
hubflow.core.SensorDefinition(wavebandDefinitions)[source]¶ Bases:
hubflow.core.FlowObjectClass for managing sensor definitions.
-
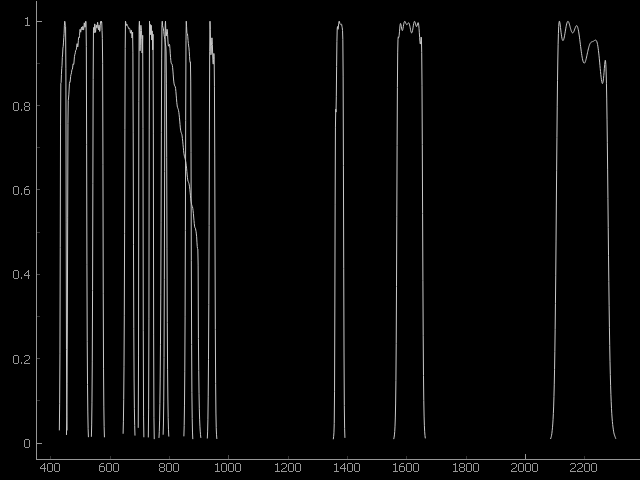
classmethod
fromEnviSpectralLibrary(library, isResponseFunction)[source]¶ Create instance from
EnviSpectralLibrary.Parameters: - library (EnviSpectralLibrary) –
- isResponseFunction (bool) – If True,
libraryis interpreted as sensor response function. If False, center wavelength and FWHM information is used.
Return type: Example: Case 1 - Library contains spectra with wavelength and FWHM information (i.e. set
isResponseFunction=False)>>> import enmapboxtestdata >>> library = EnviSpectralLibrary(filename=enmapboxtestdata.speclib) >>> SensorDefinition.fromEnviSpectralLibrary(library=library, isResponseFunction=False) # doctest: +ELLIPSIS, +NORMALIZE_WHITESPACE SensorDefinition(wavebandDefinitions=[WavebandDefinition(center=460.0, fwhm=5.8, responses=[...], name=None), ..., WavebandDefinition(center=2409.0, fwhm=9.1, responses=[...], name=None)])
Case 2 - Library contains response function (i.e. set
isResponseFunction=True)>>> import hubflow.sensors, os.path >>> library = EnviSpectralLibrary(filename = os.path.join(hubflow.sensors.__path__[0], 'sentinel2.sli')) >>> SensorDefinition.fromEnviSpectralLibrary(library=library, isResponseFunction=True) # doctest: +ELLIPSIS, +NORMALIZE_WHITESPACE SensorDefinition(wavebandDefinitions=[WavebandDefinition(center=443.0, fwhm=None, responses=[...], name=Sentinel-2 - Band B1), ..., WavebandDefinition(center=2196.5, fwhm=None, responses=[...], name=Sentinel-2 - Band B12)])
-
static
fromPredefined(name)[source]¶ Create an instance for a predefined sensor (e.g.
name='sentinel2'). SeepredefinedSensorNames()for a full list of predifined sensors. Sensor response filter functions (.sli files) are stored here hubflow/sensors.Example: >>> SensorDefinition.fromPredefined(name='sentinel2') # doctest: +ELLIPSIS, +NORMALIZE_WHITESPACE SensorDefinition(wavebandDefinitions=[WavebandDefinition(center=443.0, fwhm=None, responses=[...], name=Sentinel-2 - Band B1), ..., WavebandDefinition(center=2196.5, fwhm=None, responses=[...], name=Sentinel-2 - Band B12)])
-
static
fromRaster(raster)[source]¶ Forwards
Raster.sensorDefinition().
-
plot(plotWidget=None, yscale=1.0, **kwargs)[source]¶ Return sensor definition plot.
Parameters: - plotWidget (pyqtgraph.graphicsWindows.PlotWindow) – if None, a new plot widget is created, otherwise, the given
plotWidgetis used - yscale (float) – scale factor for y values
- kwargs – passed to
pyqtgraph.graphicsWindows.PlotWindow.plot
Return type: pyqtgraph.graphicsWindows.PlotWindow
Example: >>> plotWidget = SensorDefinition.fromPredefined(name='sentinel2').plot()
- plotWidget (pyqtgraph.graphicsWindows.PlotWindow) – if None, a new plot widget is created, otherwise, the given
-
static
predefinedSensorNames()[source]¶ Return list of predefined sensor names.
Example: >>> SensorDefinition.predefinedSensorNames() ['modis', 'moms', 'mss', 'npp_viirs', 'pleiades1a', 'pleiades1b', 'quickbird', 'rapideye', 'rasat', 'seawifs', 'sentinel2', 'spot', 'spot6', 'tm', 'worldview1', 'worldview2', 'worldview3']
-
resampleProfiles(array, wavelength, wavelengthUnits, minResponse=None, resampleAlg=None, **kwargs)[source]¶ Resample a list of profiles given as a 2d
arrayof size (profiles, bands).Implementation: the
array, together with thewavelengthandwavelengthUnitsmetadata, is turned into a spectral raster, which is resampled using :class:~hubflow.core.SensorDefinition.resampleRaster``.Parameters: - array (Union[list, numpy.ndarray]) – list of profiles or 2d array of size (profiles, bands)
- wavelength (List[float]) – list of center wavelength of size (bands, )
- wavelengthUnits (str) – wavelength unit ‘nanometers’ | ‘micrometers’
- minResponse – passed to
resampleRaster() - resampleAlg – passed to
resampleRaster() - kwargs – passed to
resampleRaster
Return type: numpy.ndarray
Example: >>> import pyqtgraph as pg >>> import enmapboxtestdata >>> sentinel2Sensor = SensorDefinition.fromPredefined(name='sentinel2') >>> enmapRaster = Raster(filename=enmapboxtestdata.enmap) >>> enmapArray = enmapRaster.array().reshape((enmapRaster.shape()[0], -1)).T >>> resampled = sentinel2Sensor.resampleProfiles(array=enmapArray, wavelength=enmapRaster.metadataWavelength(), wavelengthUnits='nanometers') >>> index = 0 # select single profile >>> plotWidget = pg.plot(x=enmapRaster.metadataWavelength(), y=enmapArray[index]) # draw original enmap profile >>> plotWidget = plotWidget.plot(x=[wd.center() for wd in sentinel2Sensor.wavebandDefinitions()], y=resampled[index]) # draw resampled profile on top

-
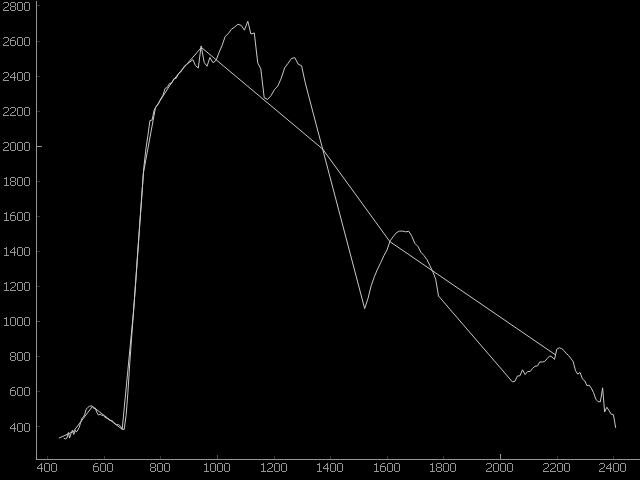
resampleRaster(filename, raster, minResponse=None, resampleAlg='linear', **kwargs)[source]¶ Resample the given spectral
raster.Parameters: - filename (str) – output path
- raster (hubflow.core.Raster) – spectral raster
- minResponse (float) – limits the wavelength region of the response filter function to wavelength with responses higher than
minResponse; higher values speed up computation; 0.5 corresponds to the full width at half maximum region; values greater 0.5 may lead to very inaccurate results - resampleAlg (enum(SensorDefinition.RESAMPLE_LINEAR, SensorDefinition.RESAMPLE_RESPONSE)) – available resampling algorithms are linear interpolation between neighbouring wavelength and response function filtering
- kwargs – passed to hubflow.core.Applier
Return type: Union[hubflow.core.Raster, None]
Example: >>> import enmapboxtestdata >>> sentinel2Sensor = SensorDefinition.fromPredefined(name='sentinel2') >>> enmapRaster = Raster(filename=enmapboxtestdata.enmap) >>> resampled = sentinel2Sensor.resampleRaster(filename='/vsimem/resampledLinear.bsq', raster=enmapRaster) >>> pixel = Pixel(x=0, y=0) >>> plotWidget = enmapRaster.plotZProfile(pixel=pixel, spectral=True, xscale=1000) # draw original enmap profile >>> plotWidget = resampled.plotZProfile(pixel=pixel, spectral=True, plotWidget=plotWidget) # draw resampled profile on top
-
wavebandDefinition(index)[source]¶ Return
WavebandDefinitionfor band given byindex.
-
wavebandDefinitions()[source]¶ Return iterator over all
WavebandDefinition’s.
-
RESAMPLE_LINEAR= 'linear'
-
RESAMPLE_OPTIONS= ['linear', 'response']
-
RESAMPLE_RESPONSE= 'response'
-
classmethod
WavebandDefinition
-
class
hubflow.core.WavebandDefinition(center, fwhm=None, responses=None, name=None)[source]¶ Bases:
hubflow.core.FlowObjectClass for managing waveband definitions.
-
center()[source]¶ Return center wavelength location.
>>> WavebandDefinition(center=560).center()
560.0
-
static
fromFWHM(center, fwhm, sigmaLimits=3)[source]¶ Create an instance from given
centerandfwhm. The waveband response function is modeled inside the range:center+/- sigma *sigmaLimits, where sigma is given byfwhm / 2.3548.Example: >>> WavebandDefinition.fromFWHM(center=500, fwhm=10) # doctest: +ELLIPSIS, +NORMALIZE_WHITESPACE WavebandDefinition(center=500.0, fwhm=10.0, responses=[(487.0, 0.009227241211564235), (488.0, 0.01845426465118729), (489.0, 0.03491721729455092), (490.0, 0.06250295020961404), (491.0, 0.10584721091054979), (492.0, 0.1695806637893581), (493.0, 0.2570344015689991), (494.0, 0.3685735673688072), (495.0, 0.5000059003147861), (496.0, 0.6417177952459099), (497.0, 0.7791678897157294), (498.0, 0.8950267608170881), (499.0, 0.9726554065273144), (500.0, 1.0), (501.0, 0.9726554065273144), (502.0, 0.8950267608170881), (503.0, 0.7791678897157294), (504.0, 0.6417177952459099), (505.0, 0.5000059003147861), (506.0, 0.3685735673688072), (507.0, 0.2570344015689991), (508.0, 0.1695806637893581), (509.0, 0.10584721091054979), (510.0, 0.06250295020961404), (511.0, 0.03491721729455092)], name=None)
-
fwhm()[source]¶ Return full width at half maximum.
>>> WavebandDefinition(center=560, fwhm=10).fwhm()
10.0
-
name()[source]¶ Return waveband name.
Example: >>> for wavebandDefinition in SensorDefinition.fromPredefined(name='sentinel2').wavebandDefinitions(): ... print(wavebandDefinition.name()) Sentinel-2 - Band B1 Sentinel-2 - Band B2 Sentinel-2 - Band B3 Sentinel-2 - Band B4 Sentinel-2 - Band B5 Sentinel-2 - Band B6 Sentinel-2 - Band B7 Sentinel-2 - Band B8 Sentinel-2 - Band B8A Sentinel-2 - Band B9 Sentinel-2 - Band B10 Sentinel-2 - Band B11 Sentinel-2 - Band B12
-
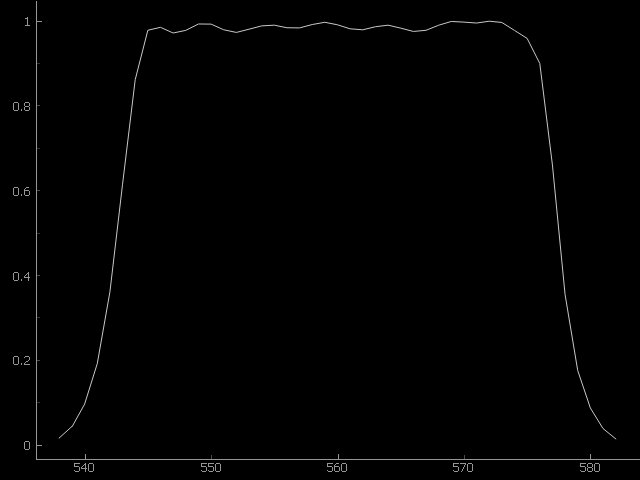
plot(plotWidget=None, yscale=1.0, **kwargs)[source]¶ Return response function plot.
Parameters: - plotWidget (pyqtgraph.graphicsWindows.PlotWindow) – if None, a new plot widget is created, otherwise, the given
plotWidgetis used - yscale (float) – scale factor for y values
- kwargs – passed to
pyqtgraph.graphicsWindows.PlotWindow.plot
Return type: pyqtgraph.graphicsWindows.PlotWindow
Example: >>> plotWidget = SensorDefinition.fromPredefined(name='sentinel2').wavebandDefinition(index=2).plot()
- plotWidget (pyqtgraph.graphicsWindows.PlotWindow) – if None, a new plot widget is created, otherwise, the given
-
resamplingWeights(sensor)[source]¶ Return resampling weights for the center wavelength of the given
SensorDefinition.Example: Calculate weights for resampling EnMAP sensor into Sentinel-2 band 3.
>>> import enmapboxtestdata
>>> enmapSensor = Raster(filename=enmapboxtestdata.enmap).sensorDefinition()
>>> enmapSensor # doctest: +ELLIPSIS, +NORMALIZE_WHITESPACE
SensorDefinition(wavebandDefinitions=[WavebandDefinition(center=460.0, fwhm=5.8, responses=[(452.0, 0.0051192261189367235), ..., (466.0, 0.051454981460462346)], name=None),
                                      ...,
                                      WavebandDefinition(center=2409.0, fwhm=9.1, responses=[(2397.0, 0.008056878623001433), ..., (2419.0, 0.035151930528992195)], name=None)])
>>> sentinel2Band4 = SensorDefinition.fromPredefined(name='sentinel2').wavebandDefinition(index=2)
>>> sentinel2Band4 # doctest: +ELLIPSIS, +NORMALIZE_WHITESPACE
WavebandDefinition(center=560.0, fwhm=None, responses=[(538.0, 0.01591234), ..., (582.0, 0.01477064)], name=Sentinel-2 - Band B3)
>>> weights = sentinel2Band4.resamplingWeights(sensor=enmapSensor)
>>> centers = [wd.center() for wd in enmapSensor.wavebandDefinitions()]
>>> list(zip(centers, weights)) # doctest: +ELLIPSIS, +NORMALIZE_WHITESPACE
[(460.0, 0.0), ..., (533.0, 0.0), (538.0, 0.01591234), (543.0, 0.6156192), (549.0, 0.99344666), (554.0, 0.98899243), (559.0, 0.99746124), (565.0, 0.98366361), (570.0, 0.99787368), (575.0, 0.95940618), (581.0, 0.03900649), (587.0, 0.0), ..., (2409.0, 0.0)]
-
responses()[source]¶ Return response function as list of (wavelength, response) tuples.
Example: >>> sentinelBlue = SensorDefinition.fromPredefined(name='sentinel2').wavebandDefinition(index=1) >>> sentinelBlue.responses() [(454.0, 0.02028969), (455.0, 0.06381729), (456.0, 0.14181057), (457.0, 0.27989078), (458.0, 0.53566604), (459.0, 0.75764752), (460.0, 0.81162521), (461.0, 0.81796823), (462.0, 0.82713398), (463.0, 0.8391982), (464.0, 0.85271397), (465.0, 0.85564352), (466.0, 0.85505457), (467.0, 0.86079216), (468.0, 0.86901422), (469.0, 0.8732093), (470.0, 0.8746579), (471.0, 0.87890232), (472.0, 0.88401742), (473.0, 0.88568426), (474.0, 0.8864462), (475.0, 0.89132953), (476.0, 0.89810187), (477.0, 0.89921862), (478.0, 0.89728783), (479.0, 0.899455), (480.0, 0.90808729), (481.0, 0.91663575), (482.0, 0.92044598), (483.0, 0.92225061), (484.0, 0.9262647), (485.0, 0.93060572), (486.0, 0.93187505), (487.0, 0.93234856), (488.0, 0.93660786), (489.0, 0.94359652), (490.0, 0.94689153), (491.0, 0.94277939), (492.0, 0.93912406), (493.0, 0.9435992), (494.0, 0.95384075), (495.0, 0.96115588), (496.0, 0.96098811), (497.0, 0.96023166), (498.0, 0.96653039), (499.0, 0.97646982), (500.0, 0.98081022), (501.0, 0.97624561), (502.0, 0.97399225), (503.0, 0.97796507), (504.0, 0.98398942), (505.0, 0.98579982), (506.0, 0.98173313), (507.0, 0.97932703), (508.0, 0.98329935), (509.0, 0.98777523), (510.0, 0.98546073), (511.0, 0.97952735), (512.0, 0.97936162), (513.0, 0.98807291), (514.0, 0.99619133), (515.0, 0.99330779), (516.0, 0.98572054), (517.0, 0.9860457), (518.0, 0.99517659), (519.0, 1.0), (520.0, 0.99782113), (521.0, 0.93955431), (522.0, 0.70830999), (523.0, 0.42396802), (524.0, 0.24124566), (525.0, 0.13881543), (526.0, 0.07368388), (527.0, 0.03404689), (528.0, 0.01505348)]
-
Applier
Applier
ApplierOperator
hubflow.core.ApplierOperator:flowClassificationArray()flowFractionArray()flowInputArray()flowInputDType()flowInputZSize()flowMaskArray()flowMasksArray()flowRasterArray()flowRegressionArray()flowVectorArray()maskFromArray()maskFromBandArray()maskFromFractionArray()setFlowMetadataBandNames()setFlowMetadataClassDefinition()setFlowMetadataFractionDefinition()setFlowMetadataNoDataValues()setFlowMetadataRegressionDefinition()setFlowMetadataSensorDefinition()
-
class
hubflow.core.ApplierOperator(*args, **kwargs)[source]¶ Bases:
sphinx.ext.autodoc.importer._MockObject-
maskFromArray(array, noDataValues=None, defaultNoDataValue=None, noDataValueSource=None, aggregateFunction=None)[source]
-